Blog

Establishing a Nonprofit

Sometimes, there are issues that current stakeholders do not have the ability or desire to solve. In these instances, it may be helpful for a nonprofit to come in and spearhead the issue.

But how exactly does one create a nonprofit? In Virginia, there are several steps to consider. They are summarized below. If you are interested in creating your own nonprofit, please do not take this information as a comprehensive explanation. You should definitely do your own research to ensure that you do not miss anything important!

Here’s the brief overview: Steps to Creating a Nonprofit in VA

Enjoy!


Arlingtonians for a Clean Environment

Interested in helping out our local environment? Working with ACE, Arlingtonians for a Clean Environment, is a great way to get involved. With yearly river and park cleanups, rain barrel workshops, trash audits, and Energy Masters training you are bound to find something that intrigues you. Check out the following powerpoint for more details on this wonderful organization.

Dendrology

Here is a brief overview of trees commonly found in Arlington, VA around our study site. This list is by no means comprehensive, and they are undoubtedly many more species which deserve a place on this list. I encourage you to use it as a jumping off point for further research into the wonderful world of trees!

Plant Invaders

Not all plants are created equal! Some non-native plants tend to spread out and take over native varieties. We call these plants invasive. Invasive plants are very destructive to an ecosystem, often out-competing native species which provide food and habitat for wildlife. Learn more here:

Web Soil Survey

For this week’s biodiversity assignment I learned to use the Web Soil Survey tools provided online by the USDA’s Natural Resource Conservation Service.

As an Extension Agent, I was already familiar with the USDA’s soil sample service. Residents all through Virginia (and I assume the rest of the country) can visit their local Extension Office to pick up a soil sample kit. They simply put some soil in a box and mail it to Virginia Tech. In return, the lab sends them a comprehensive report of their soil qualities–including information on missing or low nutrients.

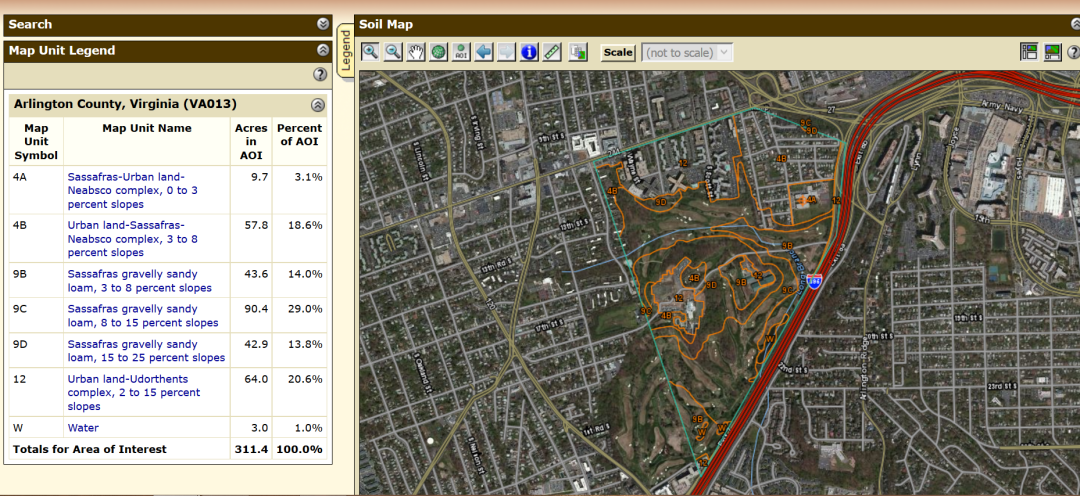
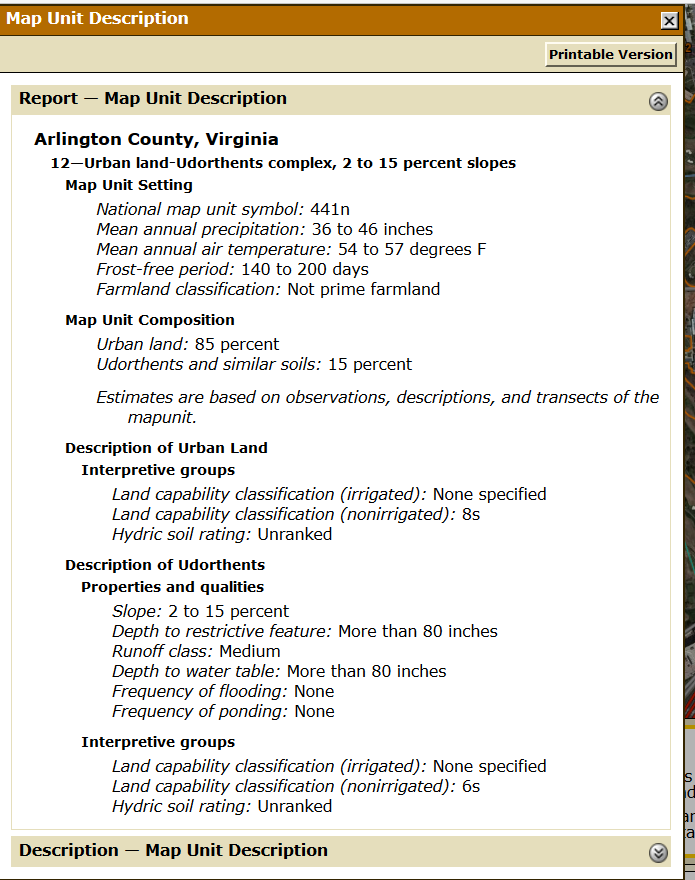
The Web Soil Survey provides a similar service but at a larger scale. By plugging in an area like a county or school district, the user can view the different major and minor components of the soil. Below, you can see a map of the Hoffman Boston School District delineated by soil type. The second image explains the characteristics of the major soil feature in the district, the “Urban land-Udorthents complex.”

This resource seems most useful to agricultural producers or professional gardeners. For the purpose of environmental education, especially for K-5, the content is a little too technical. Perhaps a high school group would be better able to utilize this information to compare soil types across a larger area. Nonetheless, I enjoyed playing around with the site and will keep it in mind for future projects.

Soil MapguideSoil Map

Weather and Climate

Along with plant and animal species diversity, weather and climate play important roles in evaluating an environment. Intense climates with harsher conditions may support less life as organisms struggle to survive. In lush regions with high precipitation, organisms may exist in incredible numbers and diversity.

Weather also plays an important role in determining how people, and specifically youth, experience the outdoor world. If it is extremely hot and humid, the youth experience will understandably be more intense than on a warm, cloudy day. The first step in understanding how climate affects the youth experience is to research climate and weather patterns. To this end, I’ve found the following helpful sources:

Weather Underground
Weather Underground allows you to chart weather patterns over a range. In the link above, I chart temperature, precipitation, and wind patterns over the last two school years.

National Oceanic and Atmospheric Administration
NOAA offers free access to historical data through their Online Climate Data catalog. You simply request which information you’re interested in and they’ll send it straight to your mailbox. For the Hoffman Boston school district, I requested the monthly climate summaries for area code 22202. While this area code does not cover the school district, its border is less than a mile south of the school. The report includes information on temperature and precipitation organized by month for 2014-2017.

Daily Air Quality

NOAA also provides information on the current air quality conditions. While I was unable to locate historical trends (showing quality each month for the past few years, for example), this is a useful tool for evaluating present conditions. Educators and youth-workers could use this tool to schedule environmental programming. By deciding to avoid outdoor programming on days with poor air quality, adults can ensure youth stay safe.
 

Ecology Slides

Teaching the value of biodiversity is a huge element of Environmental Education. We want our young people to enjoy spending time outside, and to eventually work to preserve our natural places.

Here’s a slide deck to aid future environmental presentations in a more formal classroom setting. Enjoy!

Mapping the Study Site

Here is “My Map” of the study zone. Hoffman Boston Study Zone Map

I found the tool intuitive and user-friendly. I was especially grateful that I could change the base map as the natural features were poorly marked on the default street-view map. With such a small study area (compared to a National Park, state, etc.) I found it a little challenging to identify numerous significant landmarks. I think this will become easier as I have the chance to get in the field and identify important areas in person.

Here is the ArcGIS map file: http://www.arcgis.com/home/item.html?id=42938bcbc5da41c5a1cc615705757224

The ArcGIS map was much more difficult to use. I had trouble finding a basemap to use, figuring out how to upload/link to the map, and adjusting the layers on the map. I think if I spent a significant amount of time playing with the software I would be able to make more sophisticated maps, but it is definitely not amateur-friendly.

Map of School District

So where exactly are we looking for biodiversity? Here is Arlington Public School’s map of school boundaries. We’re looking within the Hoffman Boston district, with specific attention to the area south of Columbia Pike (Rt 244).

School Districts


Searching for Nature in the Neighborhood

Over the course of the semester I propose to investigate biodiversity within the Hoffman Boston Elementary School District in Arlington, VA.

I run a 4-H afterschool nature club at Hoffman Boston. Our volunteers meet with the same group of K-5 students in the spring and fall to explore the natural world. Over the past two program seasons I’ve discovered that nature is a foreign concept for many of these children. Many do not know how plants grow. They cannot identify common birds. They rarely, if ever, spend time playing in the dirt. A child’s experiences outdoors can have a huge impact on how they view nature when they grow up.

For youth in this school district, I am interested in investigating what natural resources they have access to. Are there a variety of trees lining the streets? Are birds common sights, and if so what kind? Is the only “nature” found in carefully tended gardens? Then what does that mean for the youth who live in apartments and do not have regular access to green space?

Surveying what nature looks like in this school district is one step towards improving my environmental programming. If we find ways to connect with what these kids already know and see on a regular basis, rather my own view of what nature means, we will make strides towards engaging them on another level.